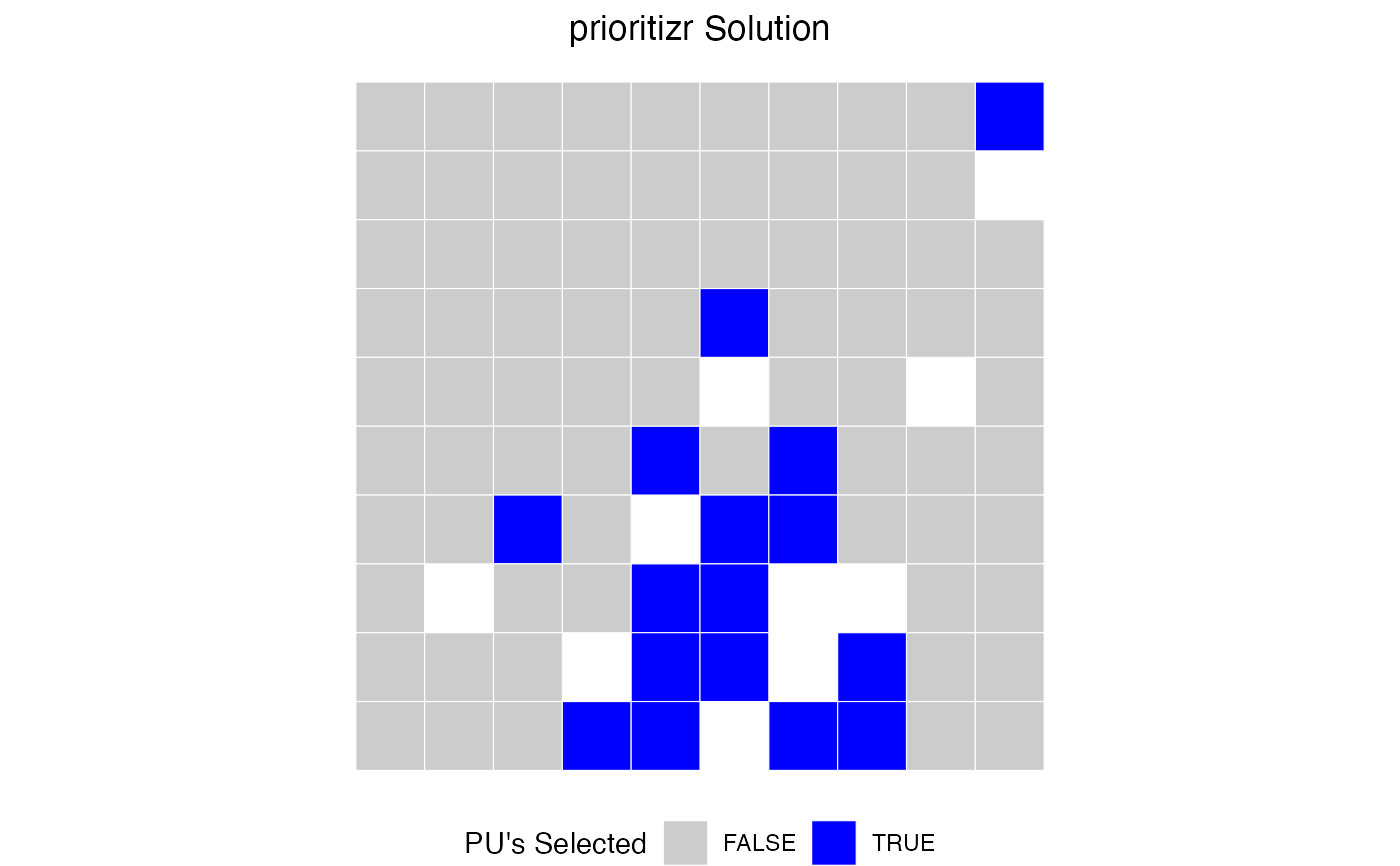
Creates a simple visualization of prioritizr solutions showing selected and unselected planning units using ggplot2
Examples
library(prioritizr)
library(sf)
library(terra)

# Get example data from prioritizr
dat <- c(get_sim_pu_raster(), get_sim_features()) %>%
  as.polygons(dissolve = FALSE, values = TRUE) %>%
  sf::st_as_sf() %>%
  dplyr::rename(cost = layer)

st_crs(dat) <- NA

features = colnames(dat) %>%
  stringr::str_subset("feature_")

# Create prioritizr problem
p <- problem(dat, features, cost_column = "cost") %>%
  add_min_set_objective() %>%
  add_relative_targets(0.17) %>%  # 17% of each feature
  add_binary_decisions() %>%
  add_default_solver(verbose = FALSE)

# Solve problem
s <- solve(p)

# Plot the solution
plot_prioritizr(s)


# Plot with custom title and column
plot_prioritizr(s, col = "solution_1", title = "My Conservation Plan")
# Plot with custom title and column
plot_prioritizr(s, col = "solution_1", title = "My Conservation Plan")
